
|
In the old days if you wanted to do wireless protocol analysis you really needed some specialised equipment. An AirPcap USB interface was a pretty coveted device in the 2010's as it allowed for sniffing of 802.11n wireless frames directly in software like Wireshark on a Windows laptop. There was also AirMagnet Wi-Fi Analyzer that required a specific AirMagnet card and driver for packet analysis and Wi-Fi troubleshooting. The cost of these tools meant that it was difficult for the average Network Engineer to be readily equipped with such capabilities. Then it became widely known that Apple MacBooks were able to switch their built-in Wi-Fi interface to monitor mode for native wireless sniffing. MacOS quickly became a popular device of choice for Wireless Professionals but many of the applications required the Windows OS to run. The lack of dual OS support still left many needing multiple devices to complete their tool-kit. Many of the legacy applications that didn't bring support to MacOS eventually became obsolete. A good example of this is how AirMagnet Survey lost most of it's market share to Ekahau, which eventually brought out a MacOS version of it's Wi-Fi modelling and survey software.
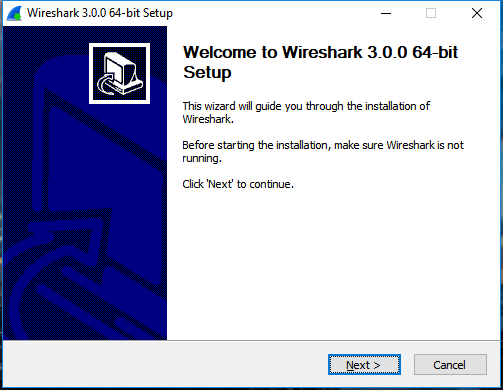
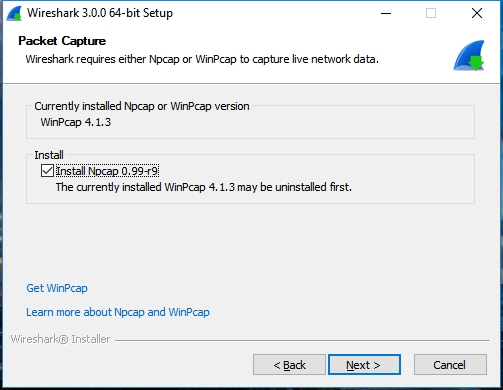
Wireshark 3.0.0 for Windows introduces a new capture driver that replaces the long standing WinPcap. It's amazing how long WinPcap has been around - I draw the indication of it's breadth of use from the Winpcap.org website. "Thanks to its set of features, WinPcap has been the packet capture and filtering engine for many open source and commercial network tools, including protocol analyzers, network monitors, network intrusion detection systems, sniffers, traffic generators and network testers. Some of these networking tools, like Wireshark, Nmap, Snort, and ntop are known and used throughout the networking community." Thanks WinPcap! We've seen some long hours together... Introducing Npcap.
OK, so paying homage to a capture driver and welcoming it's replacement is pretty nerdy. I get it. But there is more too it (it gets nerdier). Take a peek at the installation options... 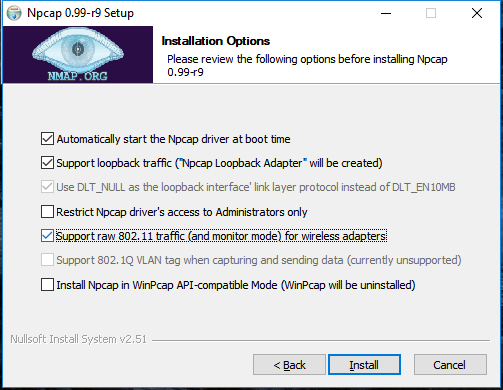 The big one here is the support for raw 802.11 traffic monitoring! It's important to note some of the other items though... capturing loopback adapters can be really useful, restricting captures to Admin only could be strategically smart and providing backwards compatibility to applications that don't yet use the new driver but are expecting to still have access to WinPcap is just plain respectful. They're cool, but monitor mode in Windows takes the cake! So at this point of the install you might imagine my excitement. Well, it didn't turn out to be as straight forward as just installing Npcap. I was half hoping to just open Wireshark and tick the monitor box much like I can on my MacBook - No Dice! Off to the manual I go https://nmap.org/npcap/guide/npcap-users-guide.html#npcap-feature-dot11-wireshark - Wireshark only honours monitor mode when it is set within the Wireshark GUI but it's not available. 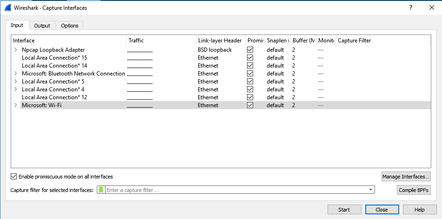 So I read about the WLANhelper.exe tool where you can manually set monitor mode on an interface https://nmap.org/npcap/guide/npcap-devguide.html#npcap-feature-dot11 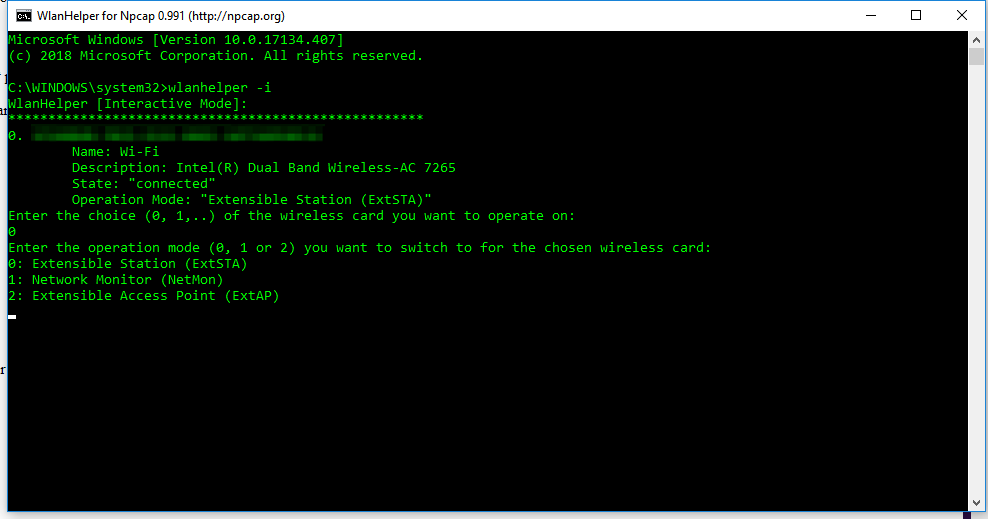 The first time I tried enabling monitor mode on my built-in NIC (Intel Dual Band Wireless-AC 7265) I got an error: 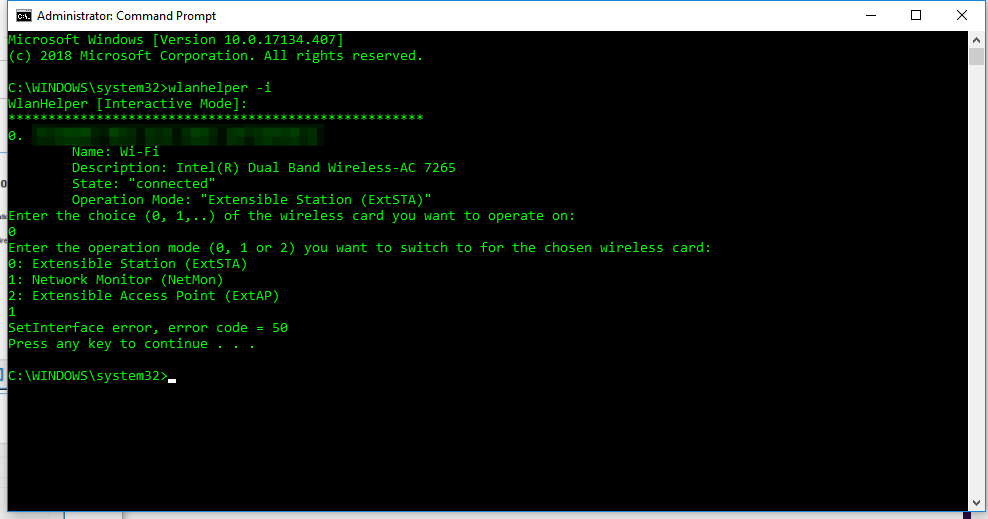 I kept getting the error and found I could check the available modes for my wireless interface with the command: wlanhelper <nic guid> modes 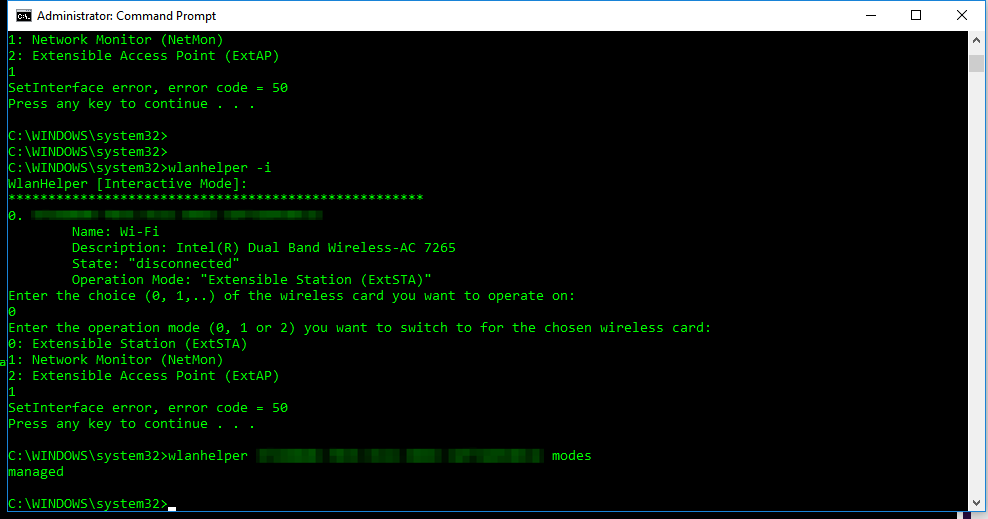 So it looks like the Intel 7265 can't do monitor mode. So what can? I found this list https://secwiki.org/w/Npcap/WiFi_adapters I do have a Savvius branded Netgear A6210. To get it recognised in Wireshark I installed the driver from the Netgear website and rebooted the laptop. I checked the wlanhelper.exe and verified the adapter existed there too. My first attempt to capture in monitor mode resulted in no packets. Second time round I disabled promiscuous mode and it worked a charm. As indicated in the Wi-Fi Adapters list this NIC doesn't pass down the Wi-Fi frequency so the radiotap header doesn't include info about the channel being captured so I had to hunt for that detail in a Beacon frame. The documentation doesn't make it apparent how you would change the frequency for the capture - there is an option command using the wlanhelper tool. 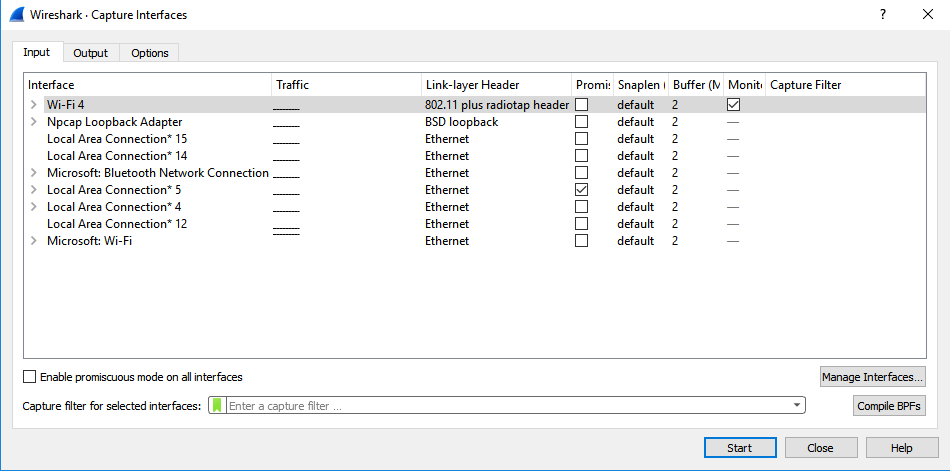 Enable monitor mode for the NIC in wlanhelper wlanhelper <guid> mode monitor or use the wlanhelper -i interactive mode then set the channel wlanhelper <guid> channel 52 check the channel wlanhelper <guid> channel 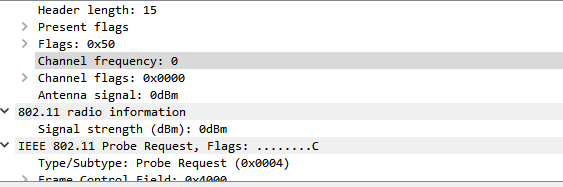 Wireshark will now be capturing from that channel as set. This can be set prior to capture or changed during a current capture.
Happy capturing team! Download Wireshark here https://www.wireshark.org/#download
Comments
Wireshark is super powerful! You just need to learn how to increase your chances of finding needles in haystacks. Needles are the packets and frames which hold the forensic truth of what actually happened, the haystack is the rest of the junk packets and frames that usually get scooped up in the process of the capture. Here are a couple of easy steps to filter both in detail and visually for some interesting types of packets. Filtering for ARP frames in Wireshark is simple. For an existing packet capture just type arp and hit enter/return in the display filter bar. The corresponding packets will show only ones with the protocol type of ARP. to edit. 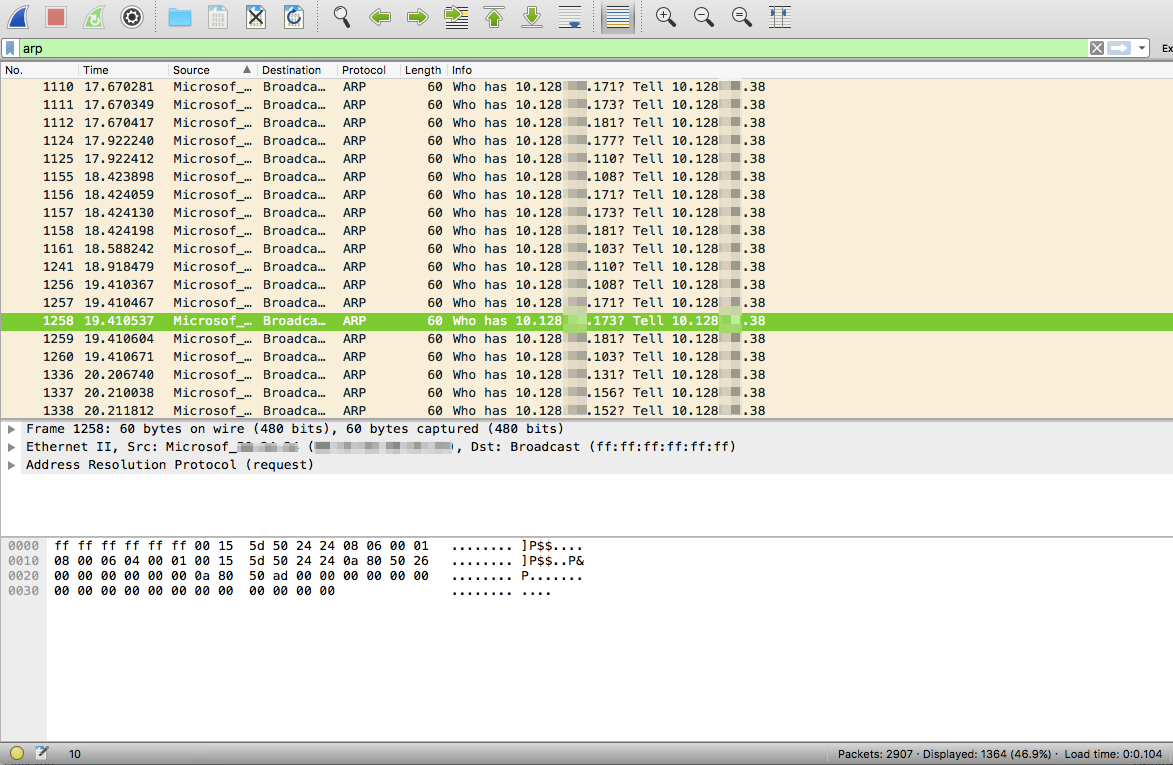 Filtering for MDNS is equally as simple. In the display filter bar you can type mdns which will filter the displayed packets to those that match the protocol of MDNS. 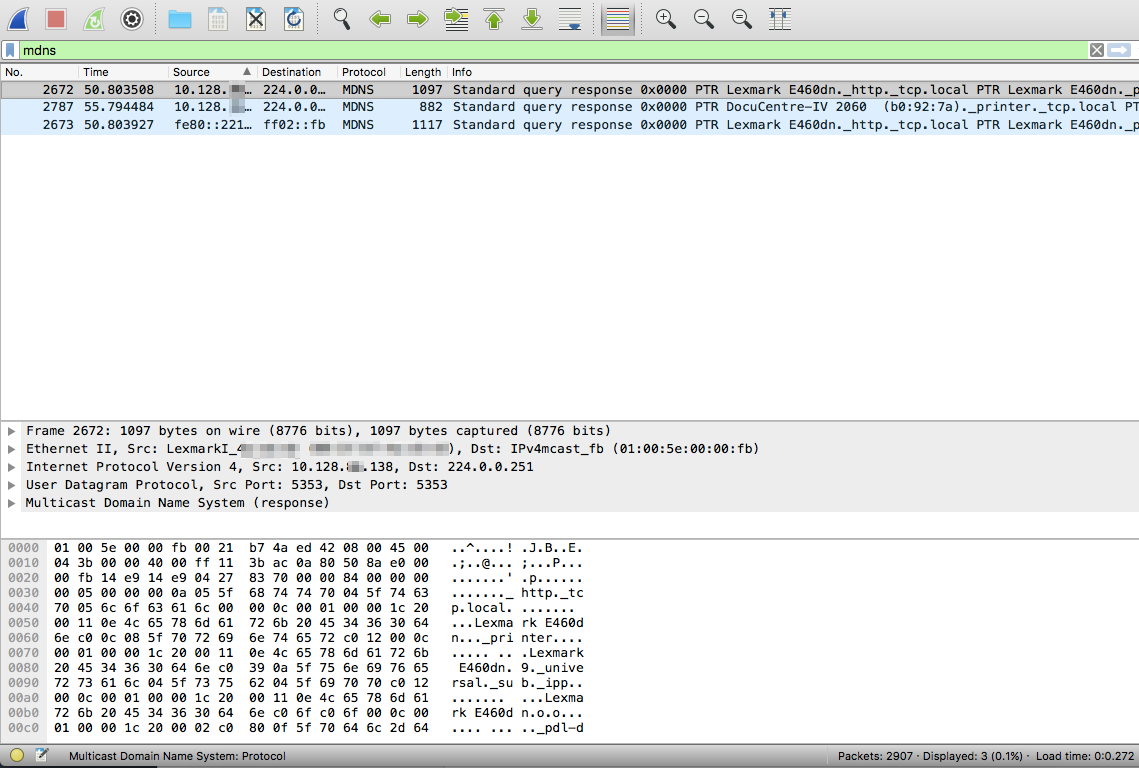 If you would like to isolate to Apple Bonjour specifically you can write a display filter for packets with a destination IP address of 224.0.0.251 as displayed below. 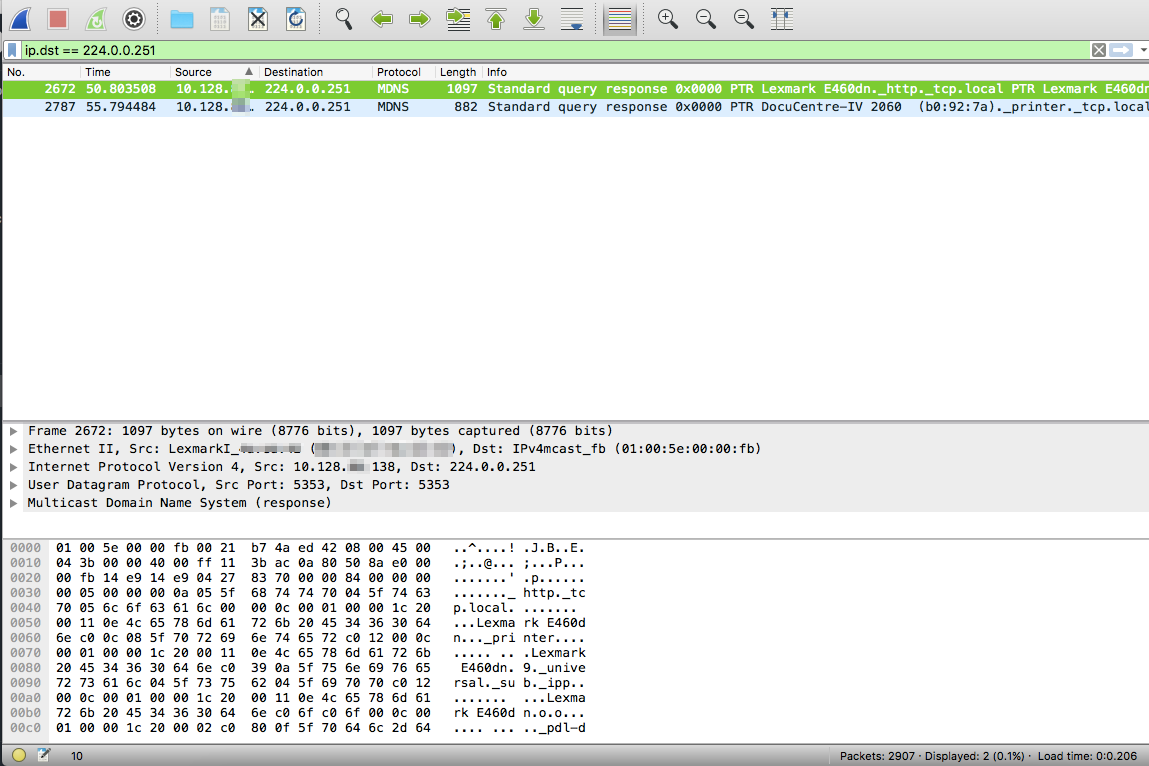 Once we know how to display specific types of packets in Wireshark we can display those packets in graphs and see their relation to each other. I really like using the I/O Graph function of Wireshark to see the relative percentage of ARP or MDNS packets to the total number of packets in a visual way. To get to the I/O Graph click on Statistics in the Menu bar and find I/O Graph. Typically the I/O Graph will open displaying a line graph which represents the packets per second over time like below: 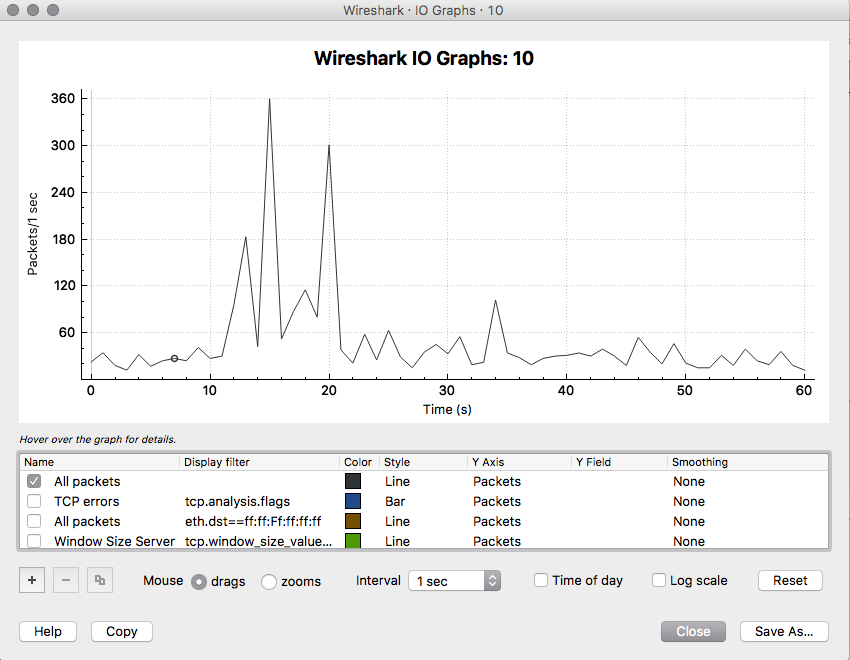 By including extra details using the display filters previously mentioned you can get a visual representation of the number of ARP packets vs the total number of packets per second. 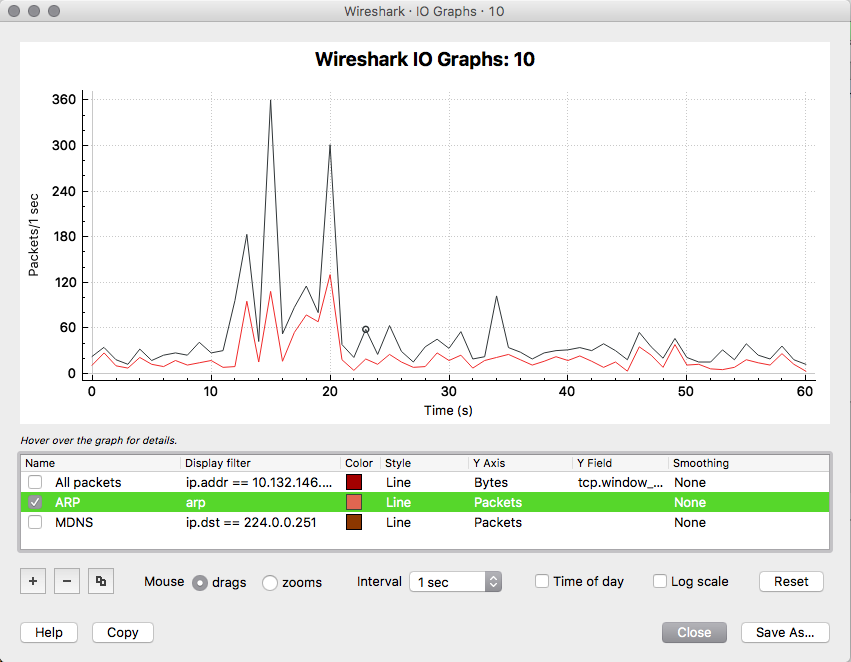 On a quiet network (overnight when no one is around) the ARP protocol might be pretty much the only type of traffic present as devices keep their ARP tables up to date. But during the day you don't want ARP to be a huge percentage of traffic on your main client network segment - this might indicate an issue which would need to be further investigated. To differentiate between the quiet and busy times on your network it is worth taking some sample captures from various points on the network and analysing the packets per second to see what is 'expected' or 'normal'. The more you look at it the more understanding you will get for the norms in your environment. To include this you simply add an additional graph detail by clicking the Plus button below the graph details pane and entering a new display filter with a customised name: 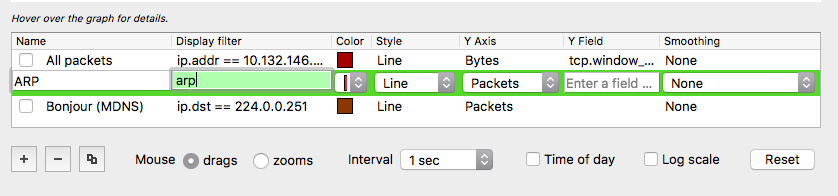 Be sure to colour your new line in a different colour so you can easily see the difference between it and other lines on the graph. Wireshark can be used in the same way for 802.11 frame captures. For example you might be able to display broadcast frames vs total frames per second within the I/O Graph, or maybe visualise management and control frames vs data frames. As you learn more display filters the I/O Graph function of Wireshark can become very powerful.
|
WifiHaxWe build and optimise networks. Continuous learning is our secret to being good. Along the learning journey we will share things here... Archives
May 2024
Categories
All
|
 RSS Feed