|
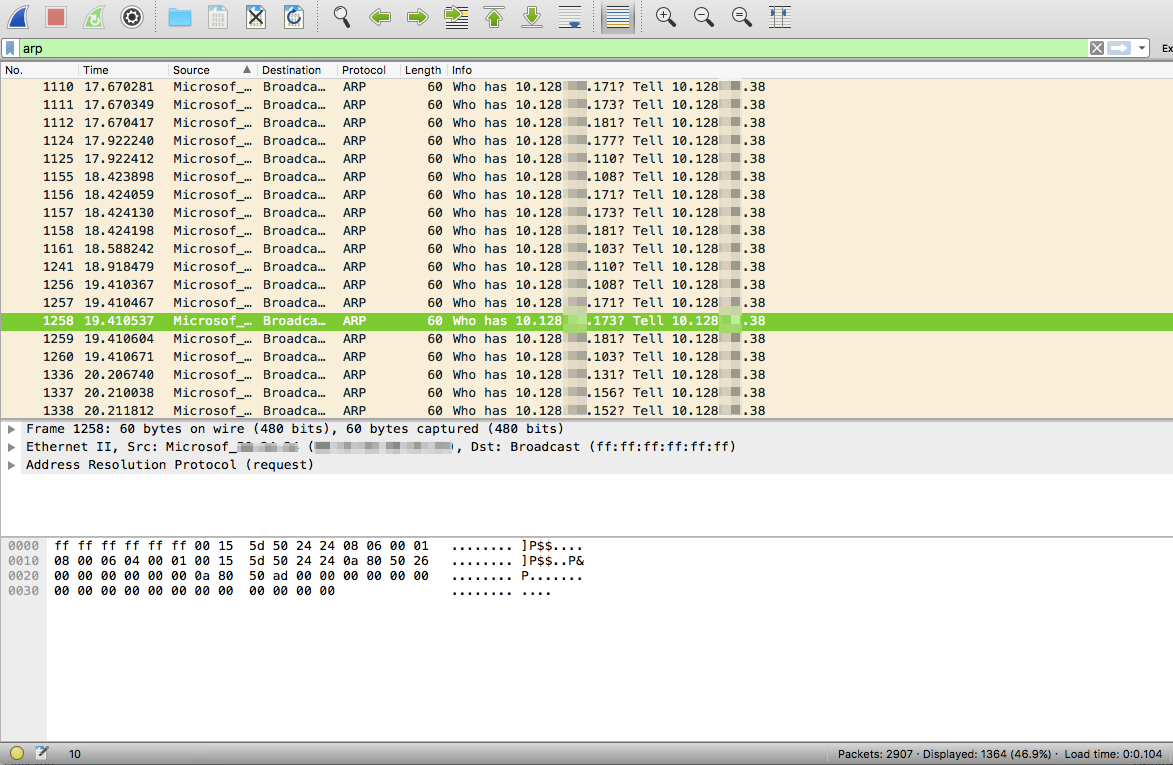
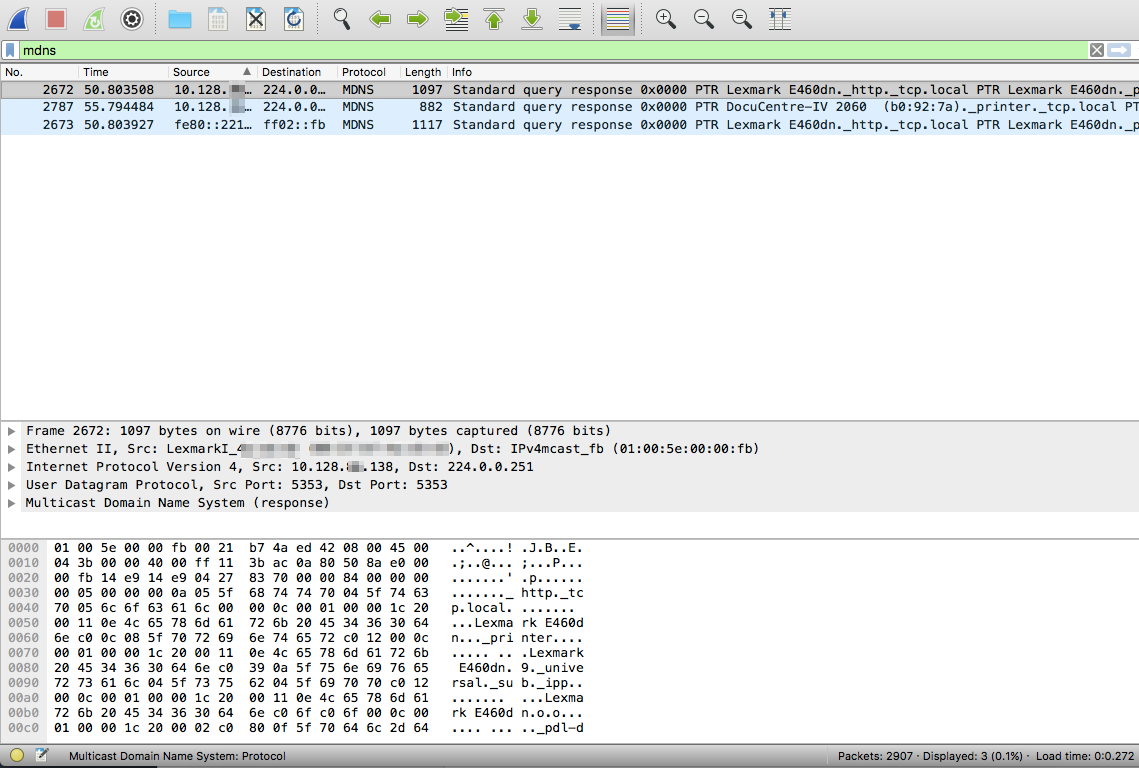
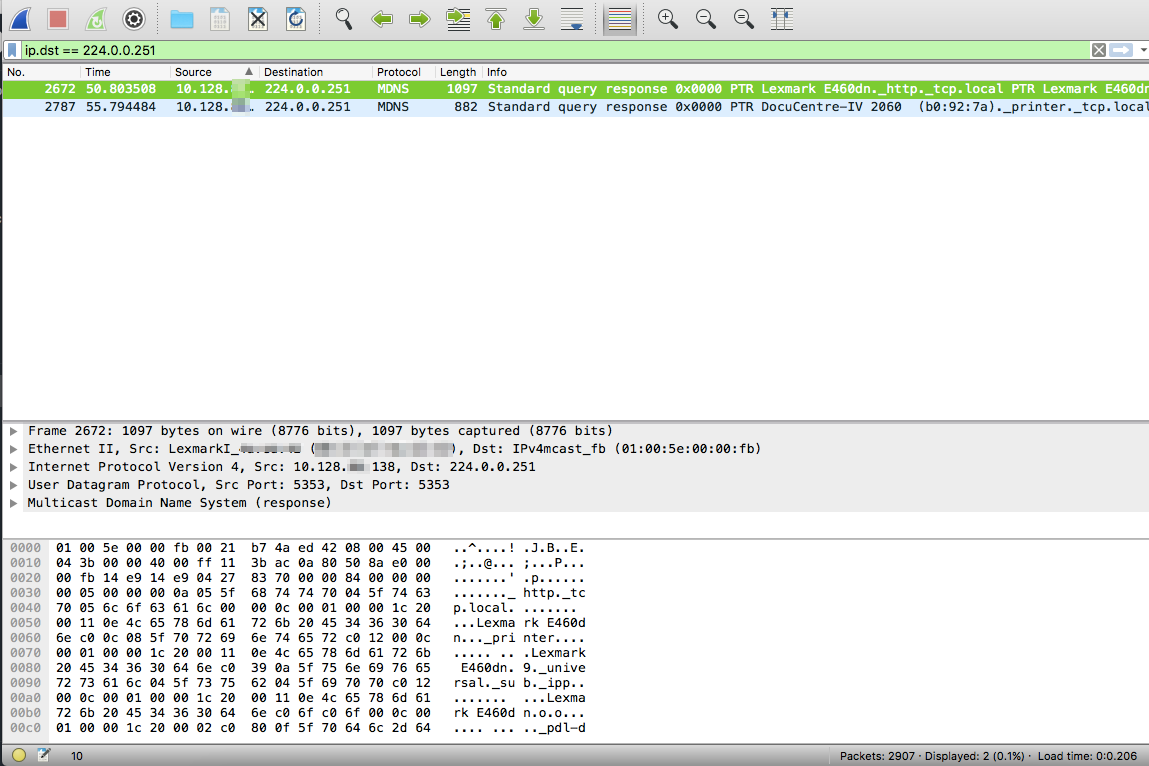
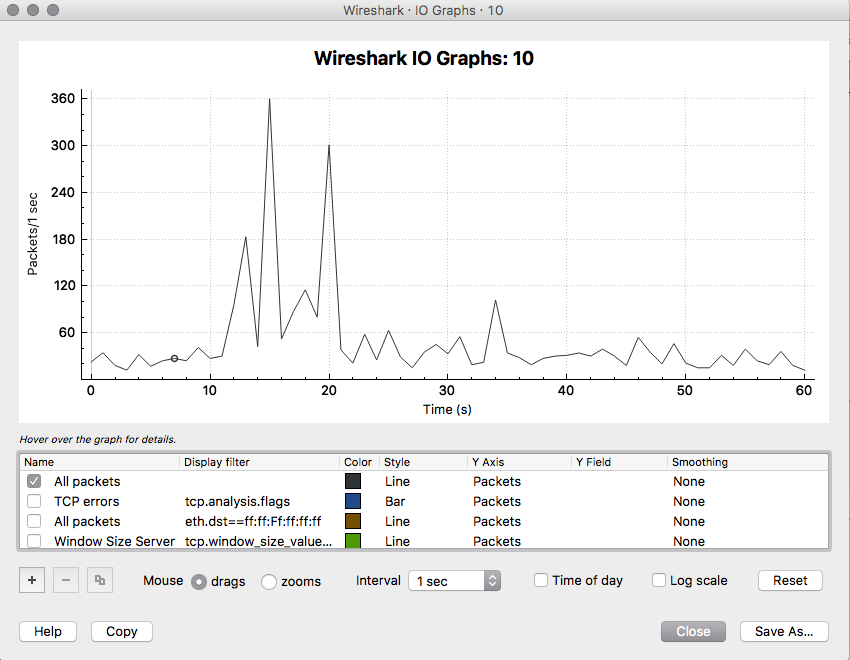
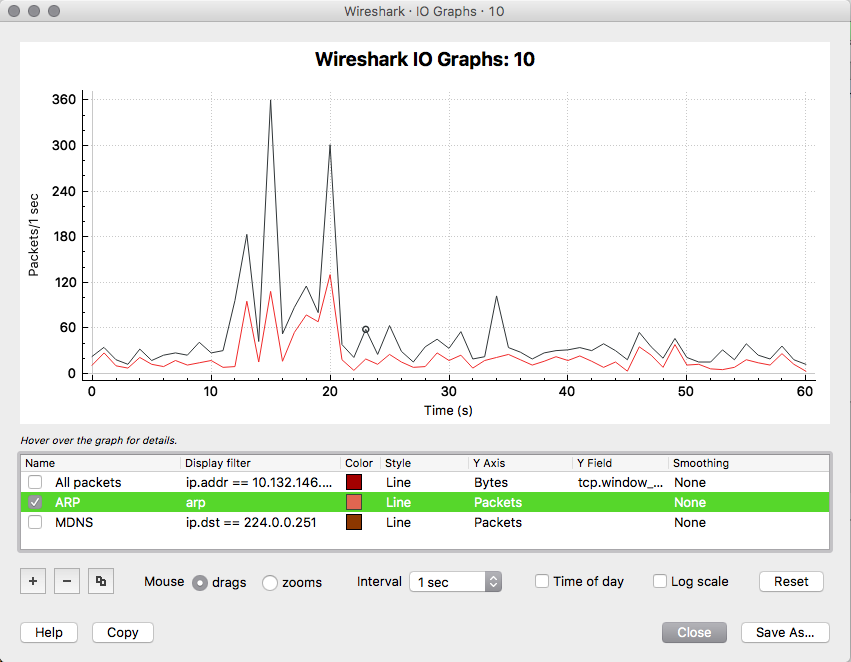
Wireshark is super powerful! You just need to learn how to increase your chances of finding needles in haystacks. Needles are the packets and frames which hold the forensic truth of what actually happened, the haystack is the rest of the junk packets and frames that usually get scooped up in the process of the capture. Here are a couple of easy steps to filter both in detail and visually for some interesting types of packets. Filtering for ARP frames in Wireshark is simple. For an existing packet capture just type arp and hit enter/return in the display filter bar. The corresponding packets will show only ones with the protocol type of ARP. to edit. Filtering for MDNS is equally as simple. In the display filter bar you can type mdns which will filter the displayed packets to those that match the protocol of MDNS. If you would like to isolate to Apple Bonjour specifically you can write a display filter for packets with a destination IP address of 224.0.0.251 as displayed below. Once we know how to display specific types of packets in Wireshark we can display those packets in graphs and see their relation to each other. I really like using the I/O Graph function of Wireshark to see the relative percentage of ARP or MDNS packets to the total number of packets in a visual way. To get to the I/O Graph click on Statistics in the Menu bar and find I/O Graph. Typically the I/O Graph will open displaying a line graph which represents the packets per second over time like below: By including extra details using the display filters previously mentioned you can get a visual representation of the number of ARP packets vs the total number of packets per second. On a quiet network (overnight when no one is around) the ARP protocol might be pretty much the only type of traffic present as devices keep their ARP tables up to date. But during the day you don't want ARP to be a huge percentage of traffic on your main client network segment - this might indicate an issue which would need to be further investigated. To differentiate between the quiet and busy times on your network it is worth taking some sample captures from various points on the network and analysing the packets per second to see what is 'expected' or 'normal'. The more you look at it the more understanding you will get for the norms in your environment. To include this you simply add an additional graph detail by clicking the Plus button below the graph details pane and entering a new display filter with a customised name: Be sure to colour your new line in a different colour so you can easily see the difference between it and other lines on the graph. Wireshark can be used in the same way for 802.11 frame captures. For example you might be able to display broadcast frames vs total frames per second within the I/O Graph, or maybe visualise management and control frames vs data frames. As you learn more display filters the I/O Graph function of Wireshark can become very powerful.
Comments
|
WifiHaxWe build and optimise networks. Continuous learning is our secret to being good. Along the learning journey we will share things here... Archives
May 2024
Categories
All
|


 RSS Feed